
Table 0 — Introduction
Reading Kenya's published figures with care, and building on them honestly.
Fenvora trains reporters and researchers to use official statistics accurately, present them fairly, and pursue data-led inquiries by lawful, transparent methods.
Table 1 — Figures at a glance
9
Years running
140+
Journalists trained
3
Core programmes
47
Counties covered
Source: Fenvora internal programme records, current cycle.
Table 2 — What we do
A quiet, methodical approach to public data.
Fenvora works with reporters, researchers and civic groups who want their use of statistics to hold up under scrutiny. We do not chase shortcuts or unverified leads. Instead we focus on the published record — census releases, sector surveys, budget documents — and how to read, present and build on it responsibly.
- Grounded entirely in lawfully published sources
- Practical sessions built around your own material
Table 3 — Programmes offered
Services
Statistical Sources Session
Learn to read Kenya's regular publications, their revisions and their limits.
Learn more →Data Presentation Review
A careful look at how figures and charts appear in your published work.
Learn more →Data-Led Investigation Programme
Build an inquiry from published data, step by documented step.
Learn more →Table 4 — Recent notes
From the blog
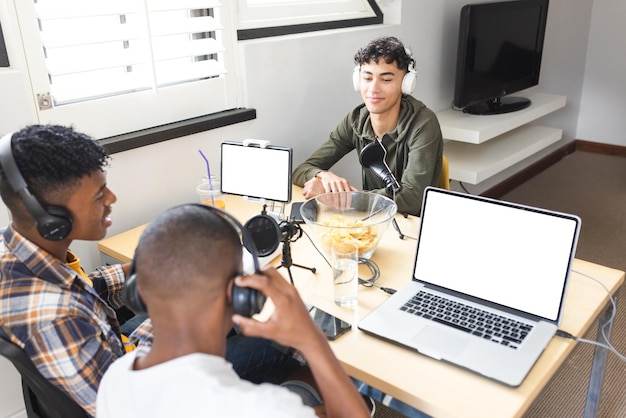
Reading Data
Why a Revised Figure Is Not a Wrong One
A look at how statistical revisions work, and how to report them without confusion.

Presentation
The Axis That Changed the Story
Small charting choices and the outsized effect they have on a reader's impression.

Method
Starting an Inquiry From the Numbers Up
Framing a question the published data can actually answer, before anything else.
Table 5 — Our approach

Method before momentum
- We work only with lawfully obtained, publicly available data
- Ordinary explanations are checked before unusual ones
- Sources and definitions are recorded as work proceeds
- Comment is sought from the bodies concerned, on the figures used
If a session sounds useful, we're glad to talk it through with you first.
Get in touchTable 6 — Participant notes
What participants say
"The session on revisions changed how I write about survey data. I stopped treating every update as a contradiction."
Wanjiku Odera
Reporter, county desk
"Our charts are far more defensible now. The review caught two scale issues we'd used for months without noticing."
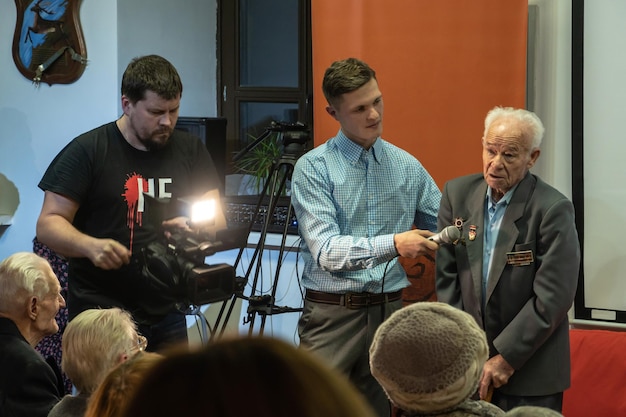
Brian Kiptoo
Data editor
"The documentation format alone was worth the programme. Our methods are now something a reader can actually check."

Achieng Otieno
Independent researcher
Table 7 — Common questions
Frequently asked
Table 8 — Reach us
Tell us a little about what you're working on
No obligation — we're happy to answer questions before you decide anything.